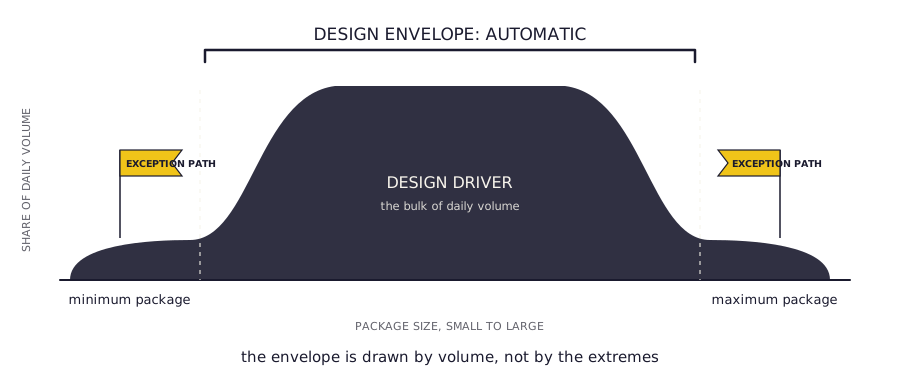
A customer sends over a spreadsheet. It lists a smallest package and a largest package, and an engineer sits down and builds a system that handles both ends. It feels like diligence. It's the trap.
The min and the max on that spreadsheet are often edge cases, products that are two percent of daily volume driving a hundred percent of the system design. That's how you end up with a conveyor twice as wide as it needs to be, or running the wrong speed, at a cost the customer didn't see coming. Product analysis is understanding not just what a customer handles, but what they handle on a normal day. That is what the system gets built around.
By the end of this lesson you should be able to build an MTBH table that a downstream engineer can trust, read a min, max, and average and say what each one drives, spot the outlier that's quietly setting the price of the whole system, and draw a design envelope the customer will actually sign.
MTBH means Material to be Handled. It's the full list of what the system will carry, and the deliverable you'll hand downstream and carry for the rest of this program. Get it right and every calculation after it inherits good inputs. Get it wrong and everything built on top inherits the error.
A complete data set covers six things: length, width, height, weight, packaging type, and volume distribution. The first four are what most engineers collect. Packaging type and volume distribution are what most engineers miss, and they're the two that decide whether you've actually understood the product or just measured it. One trap in those first four: confirm which physical dimension the customer means by each, because on the conveyor length runs in the direction of travel and width across it, and a mislabeled dimension sizes the wrong belt or throws off roller centers, the same easy-way, hard-way orientation from Lesson 5.
Packaging type tells you how the thing behaves. A rigid carton moves predictably; a polybag has no rigid bottom, so it changes shape under its own weight and jams on transfers. Dimensions alone won't tell you that. You have to name the type.
Volume distribution is the one that separates a design driver from an edge case. It's the percentage of daily volume each product or size range represents. Without it, a min and a max are just two numbers with nothing behind them. With it, you know which package the system lives on and which ones it barely sees. The deliverable records a minimum, a typical, and a maximum for every dimension, plus the volume behind each. That last column is the whole game.
The Product Spec Calc sorts product data into three buckets: minimum, maximum, and average. Knowing what each one drives is what separates an engineer who uses the tool from one who fills in fields. You'll run the numbers later; right now, know what each extreme is for.
The minimum package is a gap problem, not just a small one. In an accumulation system, zone length gets sized for the largest package, so a small one leaves most of its zone empty. It also opens a smaller gap during speed transitions, because the gap a package makes depends on its length and the speed change. If the sort was designed around average behavior, the minimum package can arrive with too little gap to act on. You don't compute that here. You learn to see it.
The maximum package sets your minimum belt width, the inside radius on your curves, and the clearance at transfers and merges. Building to it without knowing how often it shows up is where over-engineering starts.
The average package drives speed and throughput. Rate uses the average package and the gap you need between packages at a given belt speed. The average, not either extreme, is what tells you whether the system hits the number the customer asked for.
Be the smallest package for a second. You're sitting in a zone built for a carton twice your length, so most of that zone is empty behind you, and when the belt speeds up you make a smaller gap than the big cartons do. That's why the minimum package is a gap problem, not just a small one.
Taking the customer's min and max as design inputs without asking what percent of daily volume each end represents. The min and max define the range. They don't tell you what the system actually sees day to day. Ask for the volume behind each extreme before you use either one.
Your mix is 94 percent standard cartons and 6 percent oversized cases. Before you touch a calculator, what's the one thing you need to know about that 6 percent before you decide whether it belongs in the automated system? And what would you do with the answer either way?
Say the maximum package is two percent of volume. Now you've got a decision. You can design the system to handle it automatically, design an exception path for it, or ask the customer whether it belongs in the automated envelope at all. All three are legitimate. Doing it silently isn't.
The move is to load the analysis with everything first, find the outliers, then build a second version with them removed, and show the customer both. Let them see what the outlier costs. This is the cost-driver conversation in its earliest form, and you'll meet it again, larger, when the proposal gets written.
The design envelope is the range the system handles reliably and automatically. Everything inside runs without intervention. Everything outside gets a defined exception process: manual diversion, a secondary system, or a customer agreement. Drawing that line explicitly, and getting the customer to sign it, is the judgment call this whole lesson turns on.
It only works if it's an agreement. The envelope needs the customer's sign-off, it gets documented in the requirements, and it's revisited any time the product mix changes. That's the part new engineers skip. They draw it in their own head, never say it out loud, and own every edge case forever. A system with a well-defined, agreed envelope is a system the customer can be held to. Its second home is the proposal, as signed scope control, but that's a later lesson. Here you define it and document it.
If a single outlier package is what forces the conveyor from 24 inches to 36 inches, or drives the price somewhere the customer didn't expect, then build two versions of the analysis, one with the outlier and one without, and put both in front of the customer. Tradeoff: it's extra work up front, and it can feel like you're arguing against your own sale. Verify: watch the customer decide. Once they can see that one case is doubling the conveyor width, they'll tell you whether it's worth it, and now it's their informed call, not your silent assumption.
Customers almost always give you a generic min and max. Design to both ends of that range without knowing the volume behind each, and you build a system for a package that barely runs through it. The first question I ask after I see a product data set is: what percentage of your daily volume does this minimum package represent? And the maximum? If it's less than five percent on either end, that product might be a candidate for manual handling instead of a design driver. But you have to ask to even know that option exists. And if your competition asks the right question and you don't, you lose the credibility, not just the redo.

Dana's team sends over the WMS product report after the facility walk. Four products. This is the table Part II runs on.
| Product | Length | Width | Height | Weight | % Volume | Product Use |
|---|---|---|---|---|---|---|
| Small Case | 8" | 6" | 4" | 3 lbs | 4% | Packaged food |
| Standard Case | 13" | 9" | 3" | 12 lbs | 78% | All clients |
| Tall Case | 10" | 8" | 14" | 18 lbs | 12% | Apparel client |
| Large Case | 22" | 15" | 7" | 28 lbs | 6% | Housewares |
Read the volume column first. The Standard Case is 78 percent of everything that moves, so that's your design driver and the system gets optimized for it. The Small Case at 8 by 6 by 4 is your minimum, the roller-center and gap concern. The Large Case at 22 by 15 by 7 is your maximum, the one that drives belt width and curve geometry. The Tall Case is the odd one, 14 inches tall on a small base and tippy, but at 12 percent of volume it's well inside the envelope, so it stays and you flag it for the decline later.
Two products sit in the thin tails: the Small Case at 4 percent and the Large Case at 6 percent. Those are your outlier candidates. Include the Large Case and the belt gets wider and the curves get bigger for six percent of volume; exclude it and that six percent needs an exception path. The Small Case is the mirror image: include it and you're managing gap risk for four percent; exclude it and it comes off the automated line.
Build the Riverside MTBH table. Record a minimum, typical, and maximum for length, width, height, and weight, with the volume behind each. Then name the two products you'd flag as outlier candidates, and for each one write what it costs the design to include it and what happens if you leave it out. Recommend a design envelope. Then stop. The recommendation goes to the customer. You don't make the exclusion call alone.
This is Lesson 6 of thirty-five, and the MTBH table and the envelope you build here are the honest range every lesson after this one has to respect. Lesson 7 walks the full product decision chain on this exact data. Later, rate calculations size belt speed against the average you named, accumulation zones get sized against the minimum, and the mezzanine decline has to survive the Tall Case you flagged. Draw the envelope by volume, get the customer to agree to it, and write it down, and the rest of the program stands on honest ground. Draw it by the extremes instead and you carry that error the whole way through.