PART III | LESSON 10: RATE AND BOTTLENECKSMATERIAL HANDLING ACADEMY
DRIVING QUESTIONWill this flow still hold when the rate gets real?
THE NUMBER THAT'S RIGHT ON PAPER AND WRONG IN THE BUILDING
An engineer runs a rate calculator, gets a clean number, writes it on the drawing, and moves on. Then the first real wave releases, and the line that was going to do twenty cartons a minute is jamming at fifteen. Nothing broke. The math was correct. The number was still wrong for the building.
Your four-layer flow diagram tells you where material moves and roughly how much. This lesson makes that picture precise. But the formulas assume the package presents its flat bottom square to the belt, the belt runs at exactly the speed it's told, every gap holds, and nothing introduces variation. None of that's guaranteed in a real installation, and an engineer who treats a calculator output as a promise the field will keep gets surprised by the real system every time.
By the end of this lesson you should be able to set a design rate explicitly instead of drifting into average, use the Product Spec Calc to get Gap Produced and Theoretical Rate at solutioning tolerance, apply margin so the number survives the field, and run the five-question stress test against a flow before a single piece of equipment is committed.
Theoretical rate versus the rate you actually get
Every rate calculator produces a theoretical result on ideal conditions: perfect surface contact, commanded belt speed, consistent gaps, no variation. Real systems don't run that way. The biggest source of the gap between the calculated rate and the field rate is slippage: the belt moves faster than the package sitting on it, so the space that opens between cartons comes out smaller than the formula predicted, and it gets worse on inclines and in acceleration zones.
The response is margin. You never design right to the minimum. This lesson lives in early solutioning, so the rule is simple: apply plus or minus ten percent to every output and use it to confirm the flow can carry the rate, not to set a specification. You're answering one question. Can this flow do the job? You're not locking a number yet.
WHYEvery rate calculator produces a theoretical result on idealized assumptions. Real systems slip, arrive in varying orientations, and don't hold perfect gaps. Miss that and you specify a system that hits its target on paper and misses it on the floor.
WHENEvery time a calculator produces a rate or speed you'll decide with. In solutioning, apply plus or minus ten percent and confirm capability. In final engineering, tighten the inputs and set the spec. Not when: Don't treat a solutioning output as a field-guaranteed number, and don't drag final-engineering precision into a solutioning talk. You're confirming the flow can carry the rate, not sizing a sorter.
WHEREAcross every rate and speed calculation in the program. It lands here because Part III is where these tools first get used in depth against a real flow.
FAILURE IF IGNOREDYou design to the calculated minimum, the belt slips the moment it's loaded, the gap you counted on never forms, and the system that passed on paper jams under its first wave.
FIELD INSIGHT | MICHAEL COLLINS
The formulas do not account for slippage. That is the most important thing to understand about gap calculations. When you run the calculator and it gives you a minimum required gap, that is the minimum in a perfect world. In the real world, you need to add buffer to that number. How much buffer depends on the application, the belt type, the product surface, and the incline conditions. But never design right to the minimum. The gap that forms in practice will be smaller than the gap the formula assumes, and a system that was calculated to just barely meet the minimum gap will not meet it in the field.
Solutioning-level rate with the Product Spec Calc
At the diagram phase you use three outputs, and only three. The Calc Logic Guide is the formula authority. Run each at plus or minus ten percent and read it as directional, not final.
Gap Produced
SpeedOut x (L / SpeedIn) - L + StartingGap
The gap between cartons after a speed change. Accelerate and the gap grows; decelerate and it shrinks.
Worked: SpeedIn 60, SpeedOut 120, L 20 in, StartingGap 24 in gives 120 x (20/60) - 20 + 24 = 44 in. The gap grew from 24 to 44 inches when the speed doubled.
Run it for min, max, and average carton length. The min carton makes the smallest gap at SpeedOut, and that gap is the binding case downstream.
Theoretical Rate
SpeedIn / ((L + StartingGap) / 12)
The maximum cartons per minute at a given speed and gap. The divide by twelve turns the pitch from inches into feet to match speed in feet per minute.
Worked: SpeedIn 60 FPM, L 20 in, StartingGap 24 in gives 60 / ((20+24)/12) = 16.4 CPM. Design to the worst case: the longest carton gives the lower rate.
If it lands below the required rate, your levers are to increase belt speed, reduce the gap, or confirm the rate is achievable with this product mix.
Pitch
Gap + L
Center-to-center distance between cartons. Use it to sanity-check the rate.
Worked: Gap 44 in, L 20 in gives a pitch of 64 in. Every 64 inches of belt carries one carton.
TRY IT | SOLUTIONING RATE
Run the three solutioning outputs at once. Prefilled with the guide's reference inputs, 60 FPM in and a 24 inch starting gap, on Riverside's 13 inch Standard Case against the 20 CPM design target.
Theoretical rate = SpeedIn / ((L + StartingGap) / 12); Gap produced = SpeedOut x (L / SpeedIn) - L + StartingGap; Pitch = Gap + L.
One note on tool names. The old standalone calculators map onto the tabs of the Product Spec Calc now, and the Calc Logic Guide is the formula authority. Learn the tabs, not the retired names, and don't reintroduce the old names as separate tools.
PRO TIP | MC
If the Product Spec Calc hands you a Gap Produced or a Theoretical Rate, then build margin into it before you use it in any decision: design above the minimum gap and below the max theoretical rate. Tradeoff: you give up a little headroom on paper, and it can look like you're leaving rate on the table. Verify: the gap that forms in practice is smaller than the formula's, because the belt slips and the formula doesn't know that. A system calculated to just barely meet the minimum won't meet it in the field.
WHERE THIS LESSON STOPS
This lesson stops at Gap Produced, Theoretical Rate, and Pitch. The sorter sequence (CFPM, SGR, required sorter speed, model-minimum and geometric gap checks, takeaway spur speed), plus the 90-degree transfer cycle and the trunk-line gap check, are final engineering, Lesson 25 in Part VI. The curve, tumble, skew, and photoeye calculators come in Part IV and Part V. Here you're confirming the flow can carry the rate, not sizing the sorter.
Design target versus average
Before any of those numbers mean anything, you answer a question the customer usually leaves open: what rate are you designing to? The volume design target has to be set explicitly and written down. Design for full peak, or for a percentage of peak the customer agrees to supplement with temporary labor during spikes. Both are valid; leaving it unresolved isn't a choice, it's a gap. Average isn't a design target. It's the number the system beats half the time and misses the other half.
"Design rate is one of the first decisions made on any project, and it has to be made deliberately... Spikes are not exceptions in distribution. If the design rate was not explicitly agreed with the customer early in the process, the system will eventually be asked to do something it was never sized to handle."
MICHAEL COLLINS
COMMON MISTAKE
Designing for average volume and calling it a complete design. It runs smooth in the demo and every calm afternoon. Then a wave releases, or volume grows, or a station backs up, and the system that was sized for the average discovers it was never designed for the day it will actually have. Set the design target above average, deliberately, and write it down.
The five-question stress test
Once the flow has its rate target, you test it before you commit any equipment. It's a structured what-if you run out loud, no calculation: you trace the flow under conditions that differ from the calm baseline and ask whether the design still holds. Here's the script, all five, in order.
What happens when a wave releases? Every accumulation zone fills at once, induction receives at maximum rate, pack stations get their orders together. Does each section absorb the surge without backing up into upstream equipment?
What happens when a downstream station slows? A pack operator falls behind, a lane fills, a scan tunnel jams. Does upstream accumulation absorb the backup, or does it propagate all the way to induction?
What happens when volume grows twenty or thirty percent above the design target? Is there headroom, or is the system already saturated at the design point?
If flows are combined, what happens when replenishment and outbound both peak together? A conflict here is a structural design conflict that equipment can't resolve.
What happens when an exception has to be handled manually? Is there a defined path that doesn't block the main flow?
A flow that fails one of these doesn't get fixed by adding equipment; it gets fixed by redesigning the flow. Equipment selection to serve the confirmed flow comes later, in Part IV. Right now the stress test tells you whether the flow is worth building on at all.
STOP AND THINK
Take your flow and run the wave-release question out loud with someone. Describe what happens the second a wave drops and every zone fills at once. If they ask you something you can't answer, you didn't find a hole in your explanation, you found a hole in the flow. Find it now. The stress test takes twenty minutes; a redesign takes weeks.
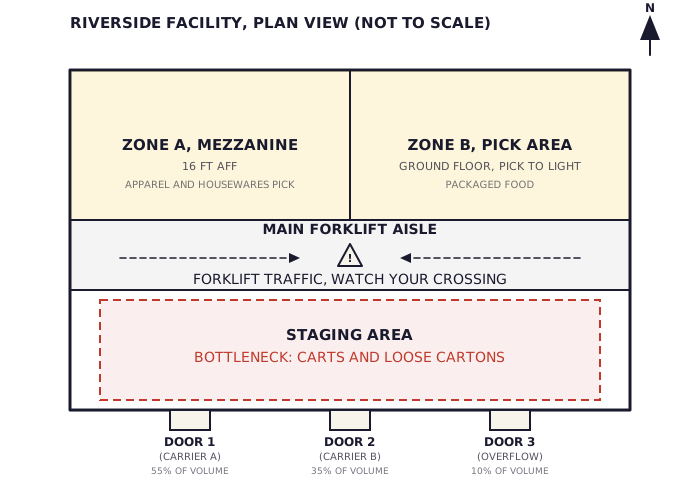
Riverside's floor: two pick zones feed one merge, one staging area, three doors. This is the flow the rate has to hold against.
RIVERSIDE PROJECT
You've got Riverside's four-layer flow diagram from Lesson 9. Layer 2 recorded what the rate needs to be. Now you find out whether the flow can carry it. Here's what Dana gave you.
"Throughput. Our current peak is 18 cartons per minute across all three doors combined. I want the new system designed for 20 cartons per minute. That gives us headroom for the growth I am projecting over the next three years."
"Volume split at the doors. Carrier A at Door 1 gets about 55 percent of our outbound volume. Carrier B at Door 2 gets 35 percent. Door 3 is the remaining 10 percent."
Set the design rate explicitly at 20 CPM, not the 18 CPM current peak. That's the deliberate call: you design to Dana's three-year projection, not to today. Split the 20 CPM across the three doors by her percentages and note each section's rate on the diagram.
Riverside rate targets (solutioning, plus or minus 10 percent)
Section
Share
Required rate
Door 1, Carrier A
55%
11 CPM
Door 2, Carrier B
35%
7 CPM
Door 3, overflow
10%
2 CPM
Combined at the merge
100%
20 CPM
Now sanity-check that the flow carries 20 CPM with the standard case, the 13-inch carton that's 78 percent of the mix from your Lesson 7 envelope. Borrow the guide's own reference inputs, 60 FPM in and a 24-inch starting gap, and swap in the 13-inch length. Theoretical Rate comes out 60 / ((13+24)/12), about 19.5 CPM: just under 20. So at solutioning tolerance the flow doesn't clear the target with margin at that speed and gap. Pull the guide's levers, bump the belt speed a little or tighten the gap, then re-confirm the section clears 20 CPM with the ten percent band. Don't run the sorter tab or the spur speed here. That's Lesson 25.
Run the five-question stress test against this flow. Name at least three things: wave-release behavior when both pick zones hit the one merge at once, the mezzanine decline-to-ground-floor handoff as a slow point, and the exception path for the carton in the wrong lane Dana's associates keep missing. Write every gap the test reveals into your Riverside note as a flow issue, not an equipment fix.
FOREST THROUGH THE TREES
Part III has been one long argument that the flow is the design and equipment comes later. This lesson is where that argument meets a number. You set a rate the flow has to carry, confirmed at solutioning tolerance that it can, and stress-tested it against the days it will actually have. Everything Part IV places on top of this flow, every conveyor, sorter, and accumulation zone, inherits the rate you set here and the margin you built into it. Get the design rate wrong or skip the stress test, and no equipment downstream saves the system. Get them right, and equipment selection becomes the easy part.
CHECKPOINT
Run Gap Produced and Theoretical Rate across a product mix that spans a short carton and a long carton. Which carton length produces the tightest gap downstream, and which one produces the lowest theoretical rate on the line? Explain why those are two different cartons, not the same one.
Describe the difference between using rate calculators in early solutioning versus final engineering. What changes between the two stages, and what stays the same? Then say what each stage owns: what solutioning has to prove, and where the spec actually gets locked.